Let's make a line graph with gnuplot
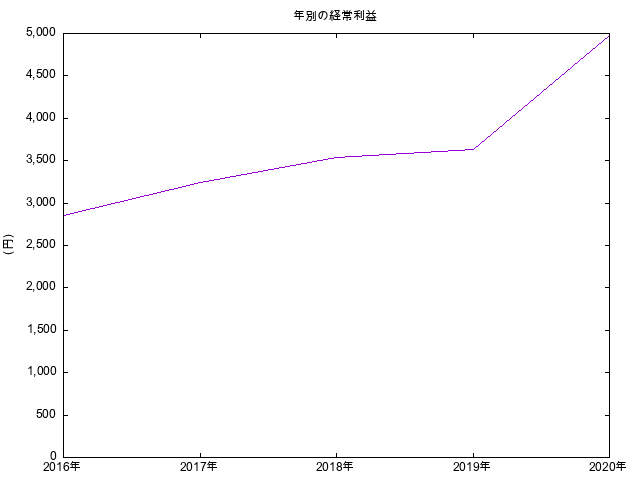
Create a line chart using gnuplot and save it as an image file. The goal is to create the graph below.
Prepare gnuplot
You can easily install it on your Mac using Homebrew.
Click here for installation method / easy usage
Create a line graph
Prepare the data
I saved it with the file name sample-line.dat.
1 "2016" 2850
2 "2017" 3240
3 "2018" 3540
4 "2019" 3630
5 "2020" 4980
Save the bar graph as an image
Save a file like the following as png_plot-lines.txt.
I also tried to specify the format of the graph.
set terminal png font "Sans,9"
set output 'test-line.png'
unset key
set title 'year sell'
set ylabel '(yen)'
set format "%'.0f"
set decimalsign locale; set decimalsign "."

plot [][0:] 'sample-line.dat' using 1:3:xtic(2) with lines</pre>

Output a line graph with the following command.
<pre>
$gnuplot png_plot-lines.txt
Did you save the target-like image "test-line.png"?
You can make it a line chart (with lines) by modifying the plot option.